Frequency Filters
Assuming we know the impulse response, h(t), for an LTI system, then we also know the
transfer function H(f), since H(f) is the Fourier Transform of h(t).
The transfer function tells us how the system reacts to every
possible input frequency. And since all possible input signals are just the sum of
sinusoids, then we can quickly find the output of an LTI system due to an arbitrary
input signal x(t):
Figure 1. The Output of an LTI system from an input x(t).
Figure 1 shows that the output of an LTI system due to a general input signal x(t) can be found
by:
For LTI systems, we see that the output can be easily found as just the product of the input Fourier
Transform and the Transfer function. This makes visualizing the affect of an LTI system simple
and the analysis much easier.
Now that we know a little bit about LTI systems:
Suppose we would like to process signals that have an undesirable "noise" at a specific frequency.
As an example, consider Figure 2, a sample input signal [G(f)], where we would like to remove the noise
at the lower frequency region:
Figure 2. The Fourier Transform (frequency-domain representation) of an Input Signal.
Note that the Fourier Transform of a real signal will have equal energy at positive and negative frequencies;
hence the symmetry in about the f=0 axis in Figure 2. The signal G(f) of Figure 2 has undesirable noise
for f<|f1|. The information or desired energy is in the frequency band |f|>f2.
The frequency regions of Figure 2 are typically classified as:
The passband, stopband and transition regions corresponding to Figure 2 is shown in Figure 3:
Figure 3. The Passband, Stopband and Transition Regions for G(f) in Figure 1.
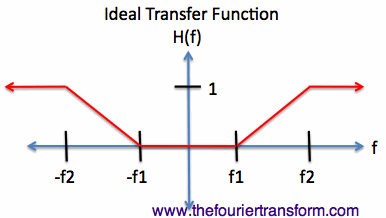
Since we know that Y(f)=H(f)X(f), then we can design an idealized filter that has H(f) = 1
for |f|>f2, and H(f) = 0 for |f|< f1, as shown in Figure 4:
Figure 4. Ideal Transfer Function H(f) to Pass the Desired Signal and Stop the Noise.
In Figure 4, note that in the passband, H(f)=1, so the desired component of the signal is passed through
the filter. In the stopband, H(f)=0, so the noise component of the signal is completely rejected.
This type of filter is known as a "highpass filter", since high frequencies pass and low frequencies
are attenuated.
From Figure 4, we can determine the impulse response, h(t) corresponding to the filter if we wanted to.
In fact, in digital signal processing, this is how the filter is designed. The inverse Fourier Transform
of the idealized filter is determined, and then a system with an impulse response is set up corresponding
to the desired signal (this is actually an easy thing to do in the digital world, since you can control
input/output relationships with code).
In our continuous/analog implementation, systems are made up of physical objects or components with the desired
properties. To give a real-world example, we will use standard electric circuit components (resistors, capacitors,
inductors)
in order to approximate the ideal filter of Figure 4. The impedance of a capacitor (with capacitance
C Farads) as function
of frequency is given by:
The impedance of an inductor (with inductance L Henries) is given by:
The impedance of a resistor (with resistance R Ohms) is:
Note that Zc and ZL are imaginary (complex) numbers. This is no big deal, as the Voltage and
Current relationships are given by Ohms law (which holds for complex numbers):
(where Z is the impedance of interest). If Z is purely imaginary (as for a capacitor or inductor),
this simply means the current I and voltage V are out of phase.
To make things concrete, suppose
f1 = 1 MHz and f2 = 10 MHz. That is, we'd like to attenuate the energy contained in the frequencies
less than 1 MHz, and pass the energy at frequencies greater than 10 MHz.
A simple highpass filter that uses a resistor and a capacitor is shown in Figure 5:
Figure 5. A Highpass R-C filter.
The input signal is the voltage v_i(t). The output voltage v_o(t) is across the resistor.
Using circuit theory, the output voltage can be calculated from the input voltage as:
To design our filter of Figure 5, we just need to choose values of R and C to try to meet
the filter specification. Using R = 100 Ohms, and C = 265 pF (picoFarads), we get the
transfer function given in Figure 6:
Figure 6. The designed high pass filter.
The first thing you might say when seeing Figure 6 is "H(f) is not zero for f< f1 and
|H(f)|<1 for f>f2". That's correct. However, whatever real filter we design, we won't be able to achieve
the ideal filter of Figure 4. Our filter of Figure 6 has |H(f)| < 0.16, and |H(f)| > 0.86.
This represents power attenuation of -15.9 dB for the stopband and just -1.3 dB for the
passband [where the power in decibels is = 20*log10( |H(f)| ) ]. Hence, the signal-to-noise ratio using
the RC circuit filter of Figure 5 will be significantly increased. If a more ideal frequency filter
is desired, more components can be used (the filter is then said to be higher-order).
This is how filtering is often done in actual electronics systems.
The Fourier Transform is extensively used in LTI system theory, filtering and signal processing.
In fact, the majority of the analysis takes place in the frequency domain, making the understanding
of Fourier Theory indispensable.
The Output of an LTI System to a General Input

Frequency Filters


Implementation - Electric Circuits

[Equation 1]

[Equation 2]

[Equation 3]
[Equation 4]


[Equation 5]

Back: Frequency Filters
Fourier Transform Applications
Fourier Transform (Home)